Precipitation data
Precipitation data and climate change scenarios were obtained from WorldClim. WorldClim is a database of high spatial resolution global weather and climate data. These data can be used for mapping and spatial modeling. The data are provided for use in research and related activities, and some specialized skills and knowledge are needed to use them.
Training
Each time you request a calculation on this platform, the tool performs three annual iterations as 'training'. This is important because it allows more accurate results to be generated. The first iteration, for example, considers the storage tank 'found empty' at the start of the year. The second iteration, on the other hand, starts with the water level that 'was found in the tank' at the end of the first iteration. Finally, the state of the system in the third iteration also depends on the second iteration. The 'training' system allows for a model that works for all years of system operation and not just the first year of operation.
Infíltrated volume
The infiltrated volume is the amount of water that exceeds the tank's capacity and overflows. The tool displays this volume in liters per year, along with its month-by-month distribution. Instead of letting this water be lost to runoff, you can use it by infiltrating it into the ground using techniques suited to the terrain. This allows the water to penetrate the soil gradually and helps retain moisture. The size and design of the infiltration area will depend on the volume of excess water, the soil type, and site characteristics.
Pre-filter Coefficients
The pre-filtering system is composed of a grid and a first rain separator.This system is of utmost importance because it allows discarding the water from the first minutes of rain. This prevents residues accumulated on the roof from entering the storage tank.
Design Factors
Different roofs have different runoff coefficients, depending on the material they are made of and their slope. The following table shows the runoff coefficient considered in all calculations of this tool, as well as other design factors considered in the tool.
| Concept | Value | Units | Reference |
|---|---|---|---|
| First rain separators per 100 m² of roof in rural areas | 0.50 | u/100m² | [1] |
| First rain separators per 100 m² of roof in urban areas | 1.00 | u/100m² | [1] |
| Number of filters needed per 10 users | 1.00 | u/100p | [1] |
| Cost of a first rain separator | 1600.00 | MXN | [1] |
| Cost of system installation based on the cost of filters and the tank | 20.00 | % | [1] |
| Water losses attributable to runoff coefficient | 20.00 | % | [1] |
| Water losses attributable to first rain separator | 0.00 | L/d | [1] |
Usage Factors
The following table shows the most frequently used assumptions in the calculation of water consumption in liters per person per day (L/p/d)
Minimum recommended
| Concept | Value | Units | Reference |
|---|---|---|---|
| Human consumption | 5 | L/p/d | [2] |
| Sanitation | 20 | L/p/d | [2] |
| Personal hygiene (shower, hands, and teeth) | 15 | L/p/d | [2] |
| Food preparation | 10 | L/p/d | [2] |
| Total | 50 | L/p/d | [2] |
Schools
| Concept | Value | Units | Reference |
|---|---|---|---|
| Recommended human consumption | 0.5 a 2.0 | L/p/d | [3] |
| Human consumption in drinking fountains | 0.2 a 0.4 | L/p/d | [4] |
| Food preparation | 0.5 a 3.0 | L/p/d | [3] |
| Hand washing | 0.5 a 5 | L/p/d | [3] |
| Toilet | 20 a 50 | L/p/d | [3] |
| Efficient toilet | 10 a 20 | L/p/d | [3] |
| Toilet separator of liquids and solids | 0 a 0.5 | L/p/d | [3] |
| Urinal | 2 a 5 | L/p/d | [3] |
| Dry urinal | 0 a 0.1 | L/p/d | [3] |
| School cleaning | 1 a 50 | L/p/d | [3] |
Household
| Concept | Value | Units | Reference |
|---|---|---|---|
| Average total urban housing use in Mexico | 250 | L/p/d | [5] |
| Minimum total use in scarcity context | 50 | L/p/d | [2] |
| Human consumption | 2 a 5 | L/p/d | [2] |
| Food preparation | 15 a 50 | L/p/d | [2] |
| Personal hygiene (shower, hands, and teeth) | 30 a 100 | L/p/d | [2] |
| Toilet | 40 a 100 | L/p/d | [2] |
| Efficient toilet | 10 a 30 | L/p/d | [3] |
| Toilet separator of liquids and solids | 0 a 0.5 | L/p/d | [3] |
| Urinal | 5 a 10 | L/p/d | [3] |
| Dry urinal | 0 a 0.1 | L/p/d | [3] |
| Laundry | 15 a 50 | L/p/d | [2] |
| Cleaning and other household uses | 5 a 100 | L/p/d | [2] |
Calendar
Days with and without water consumption
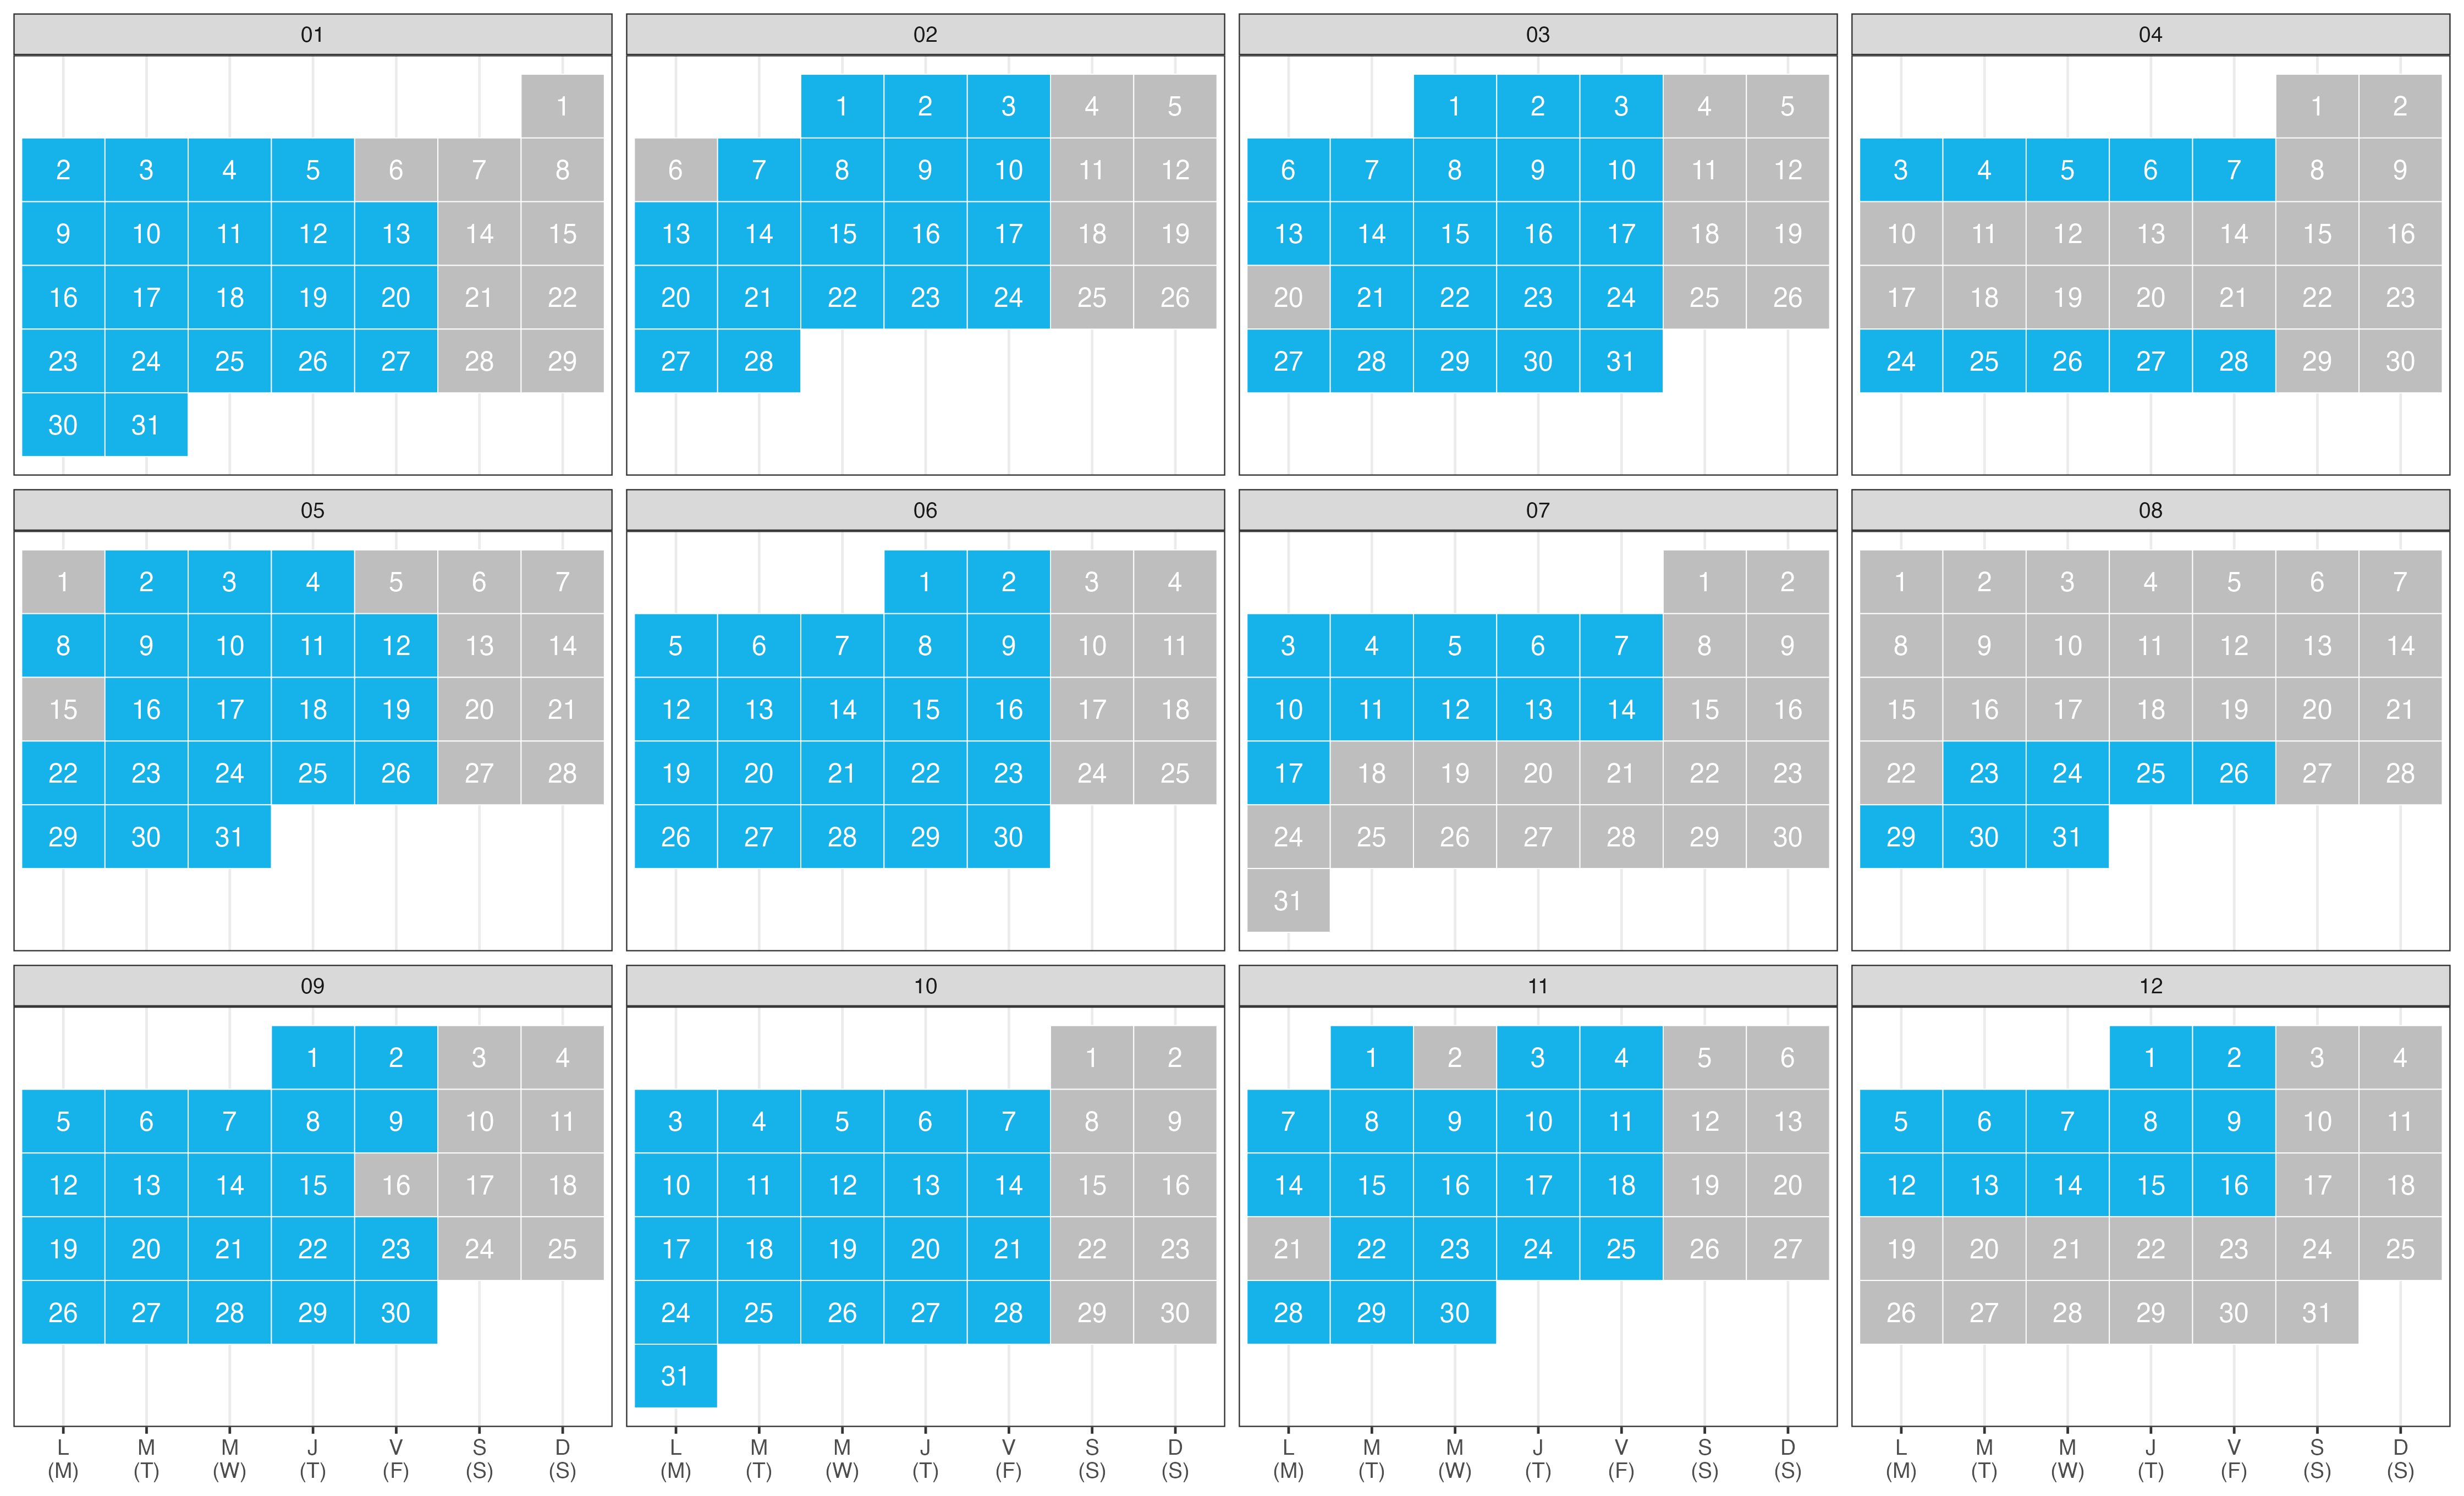
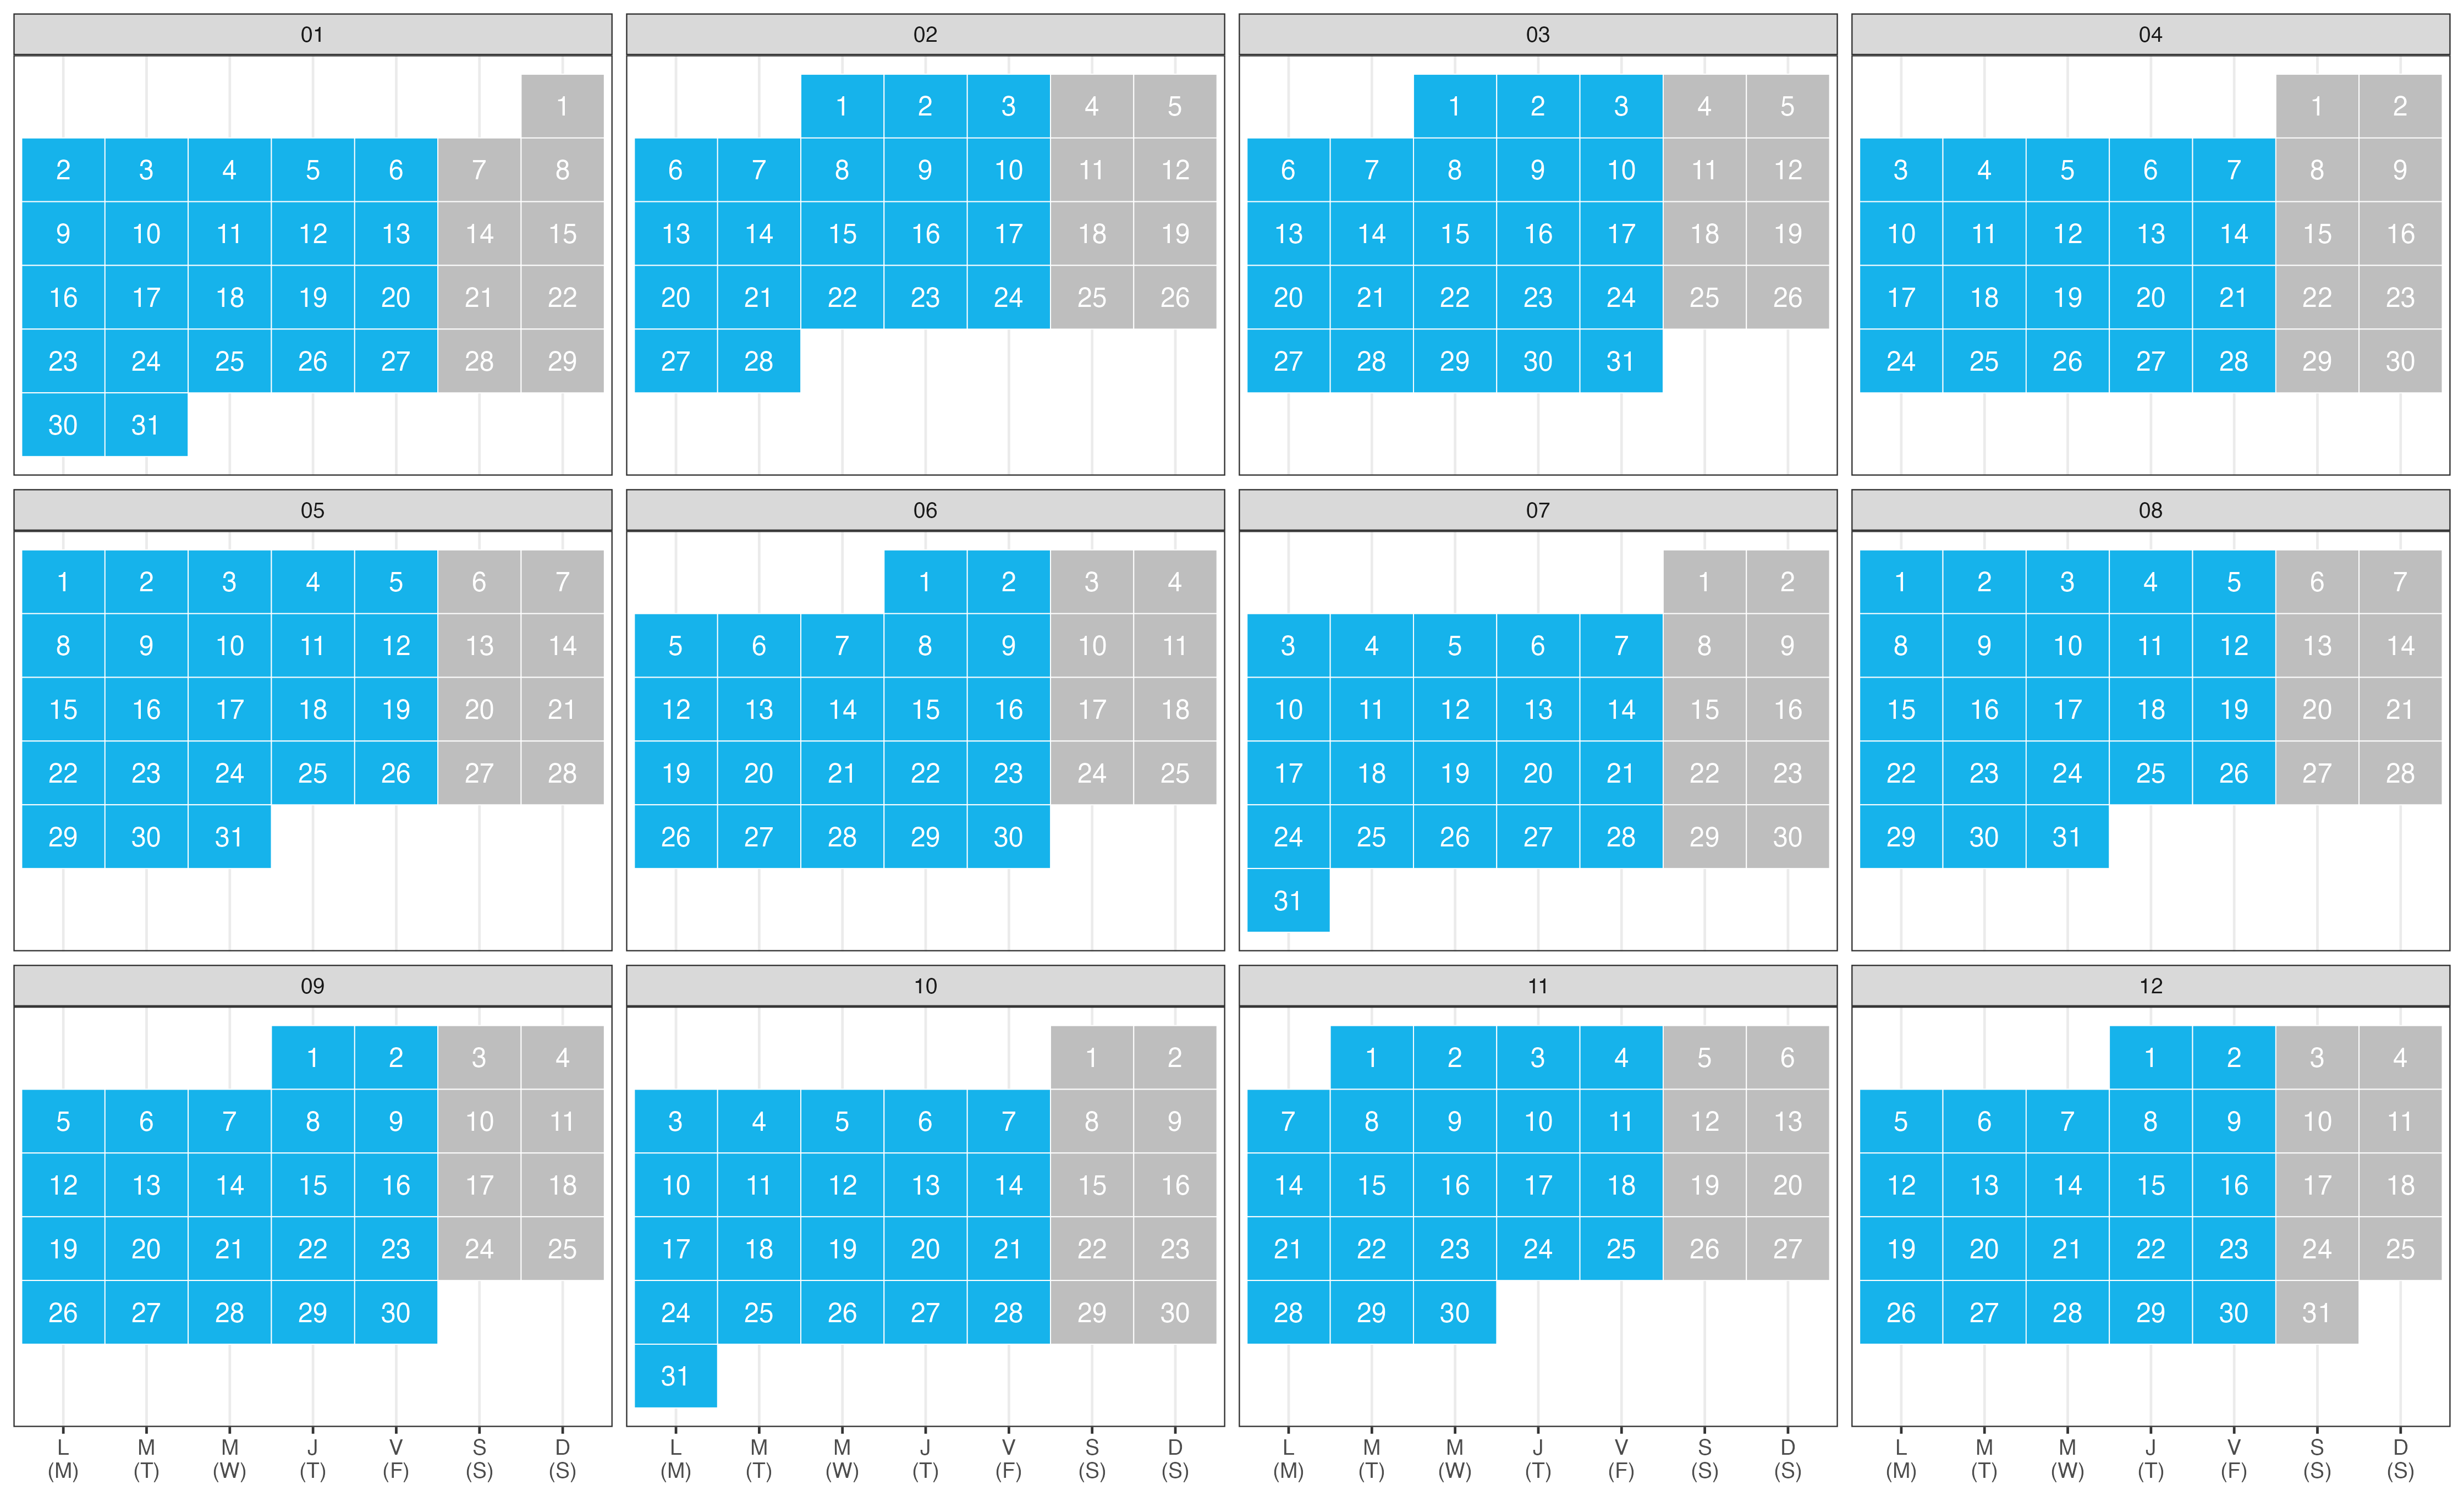
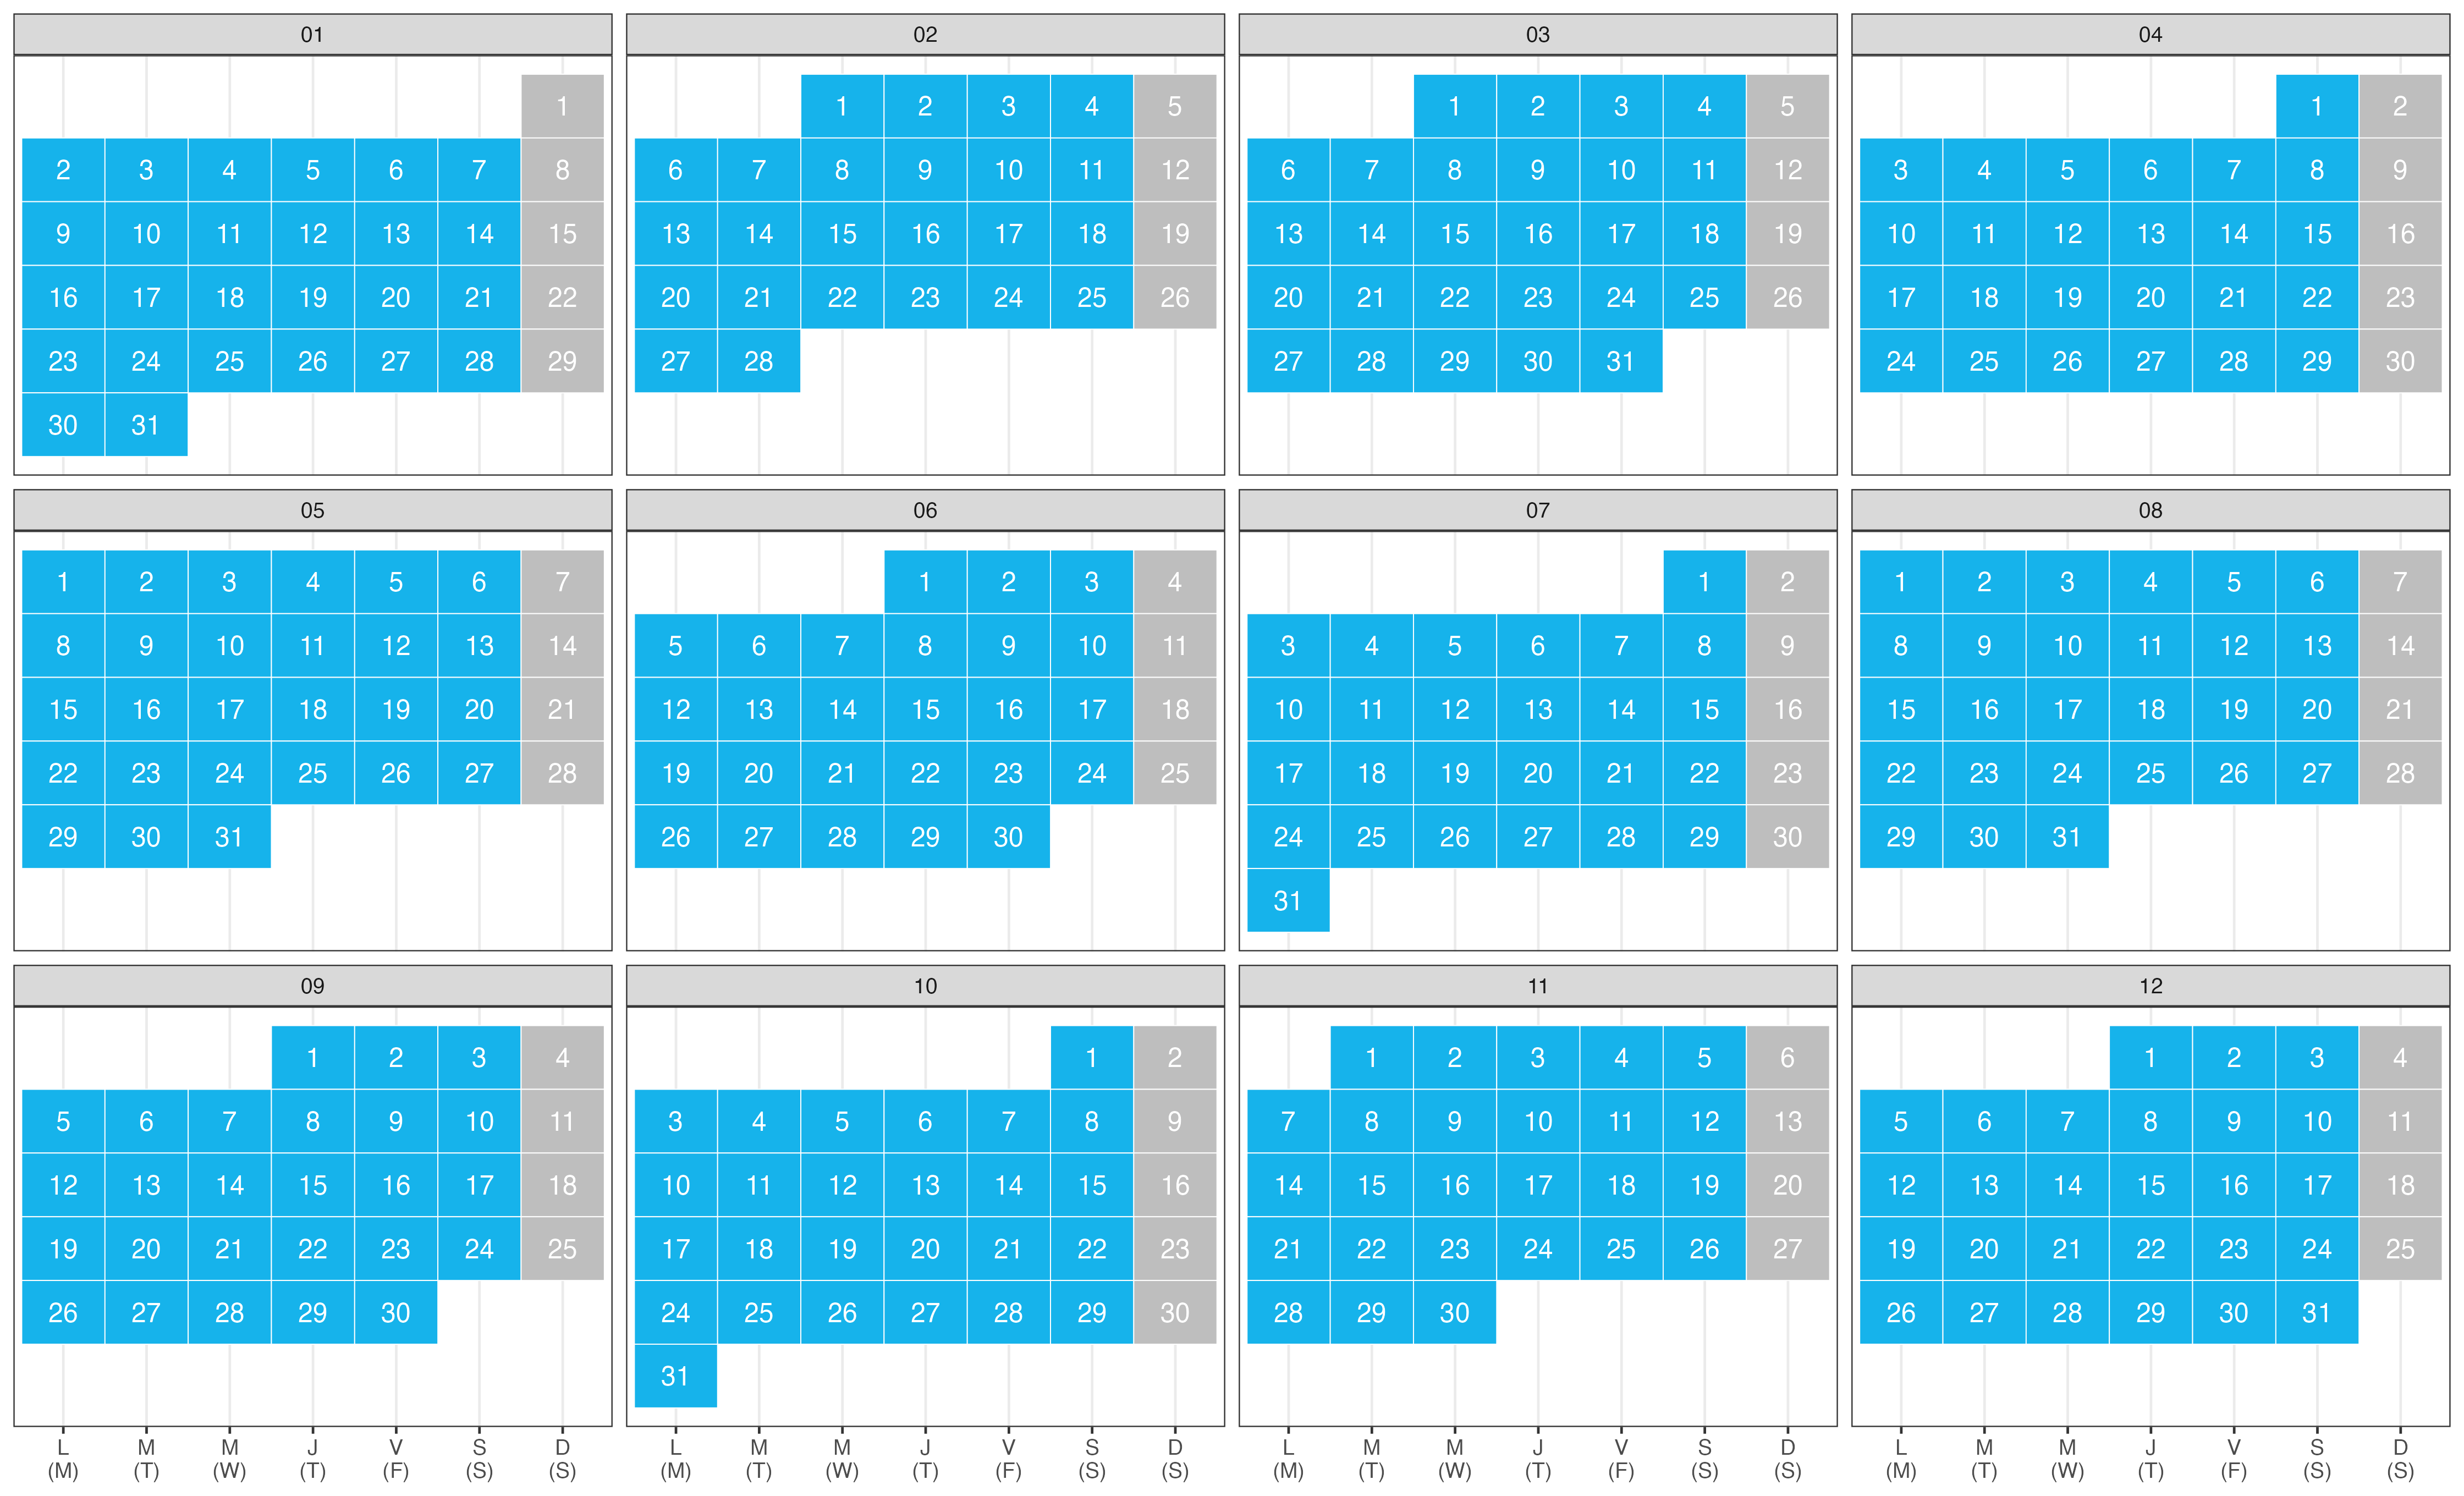
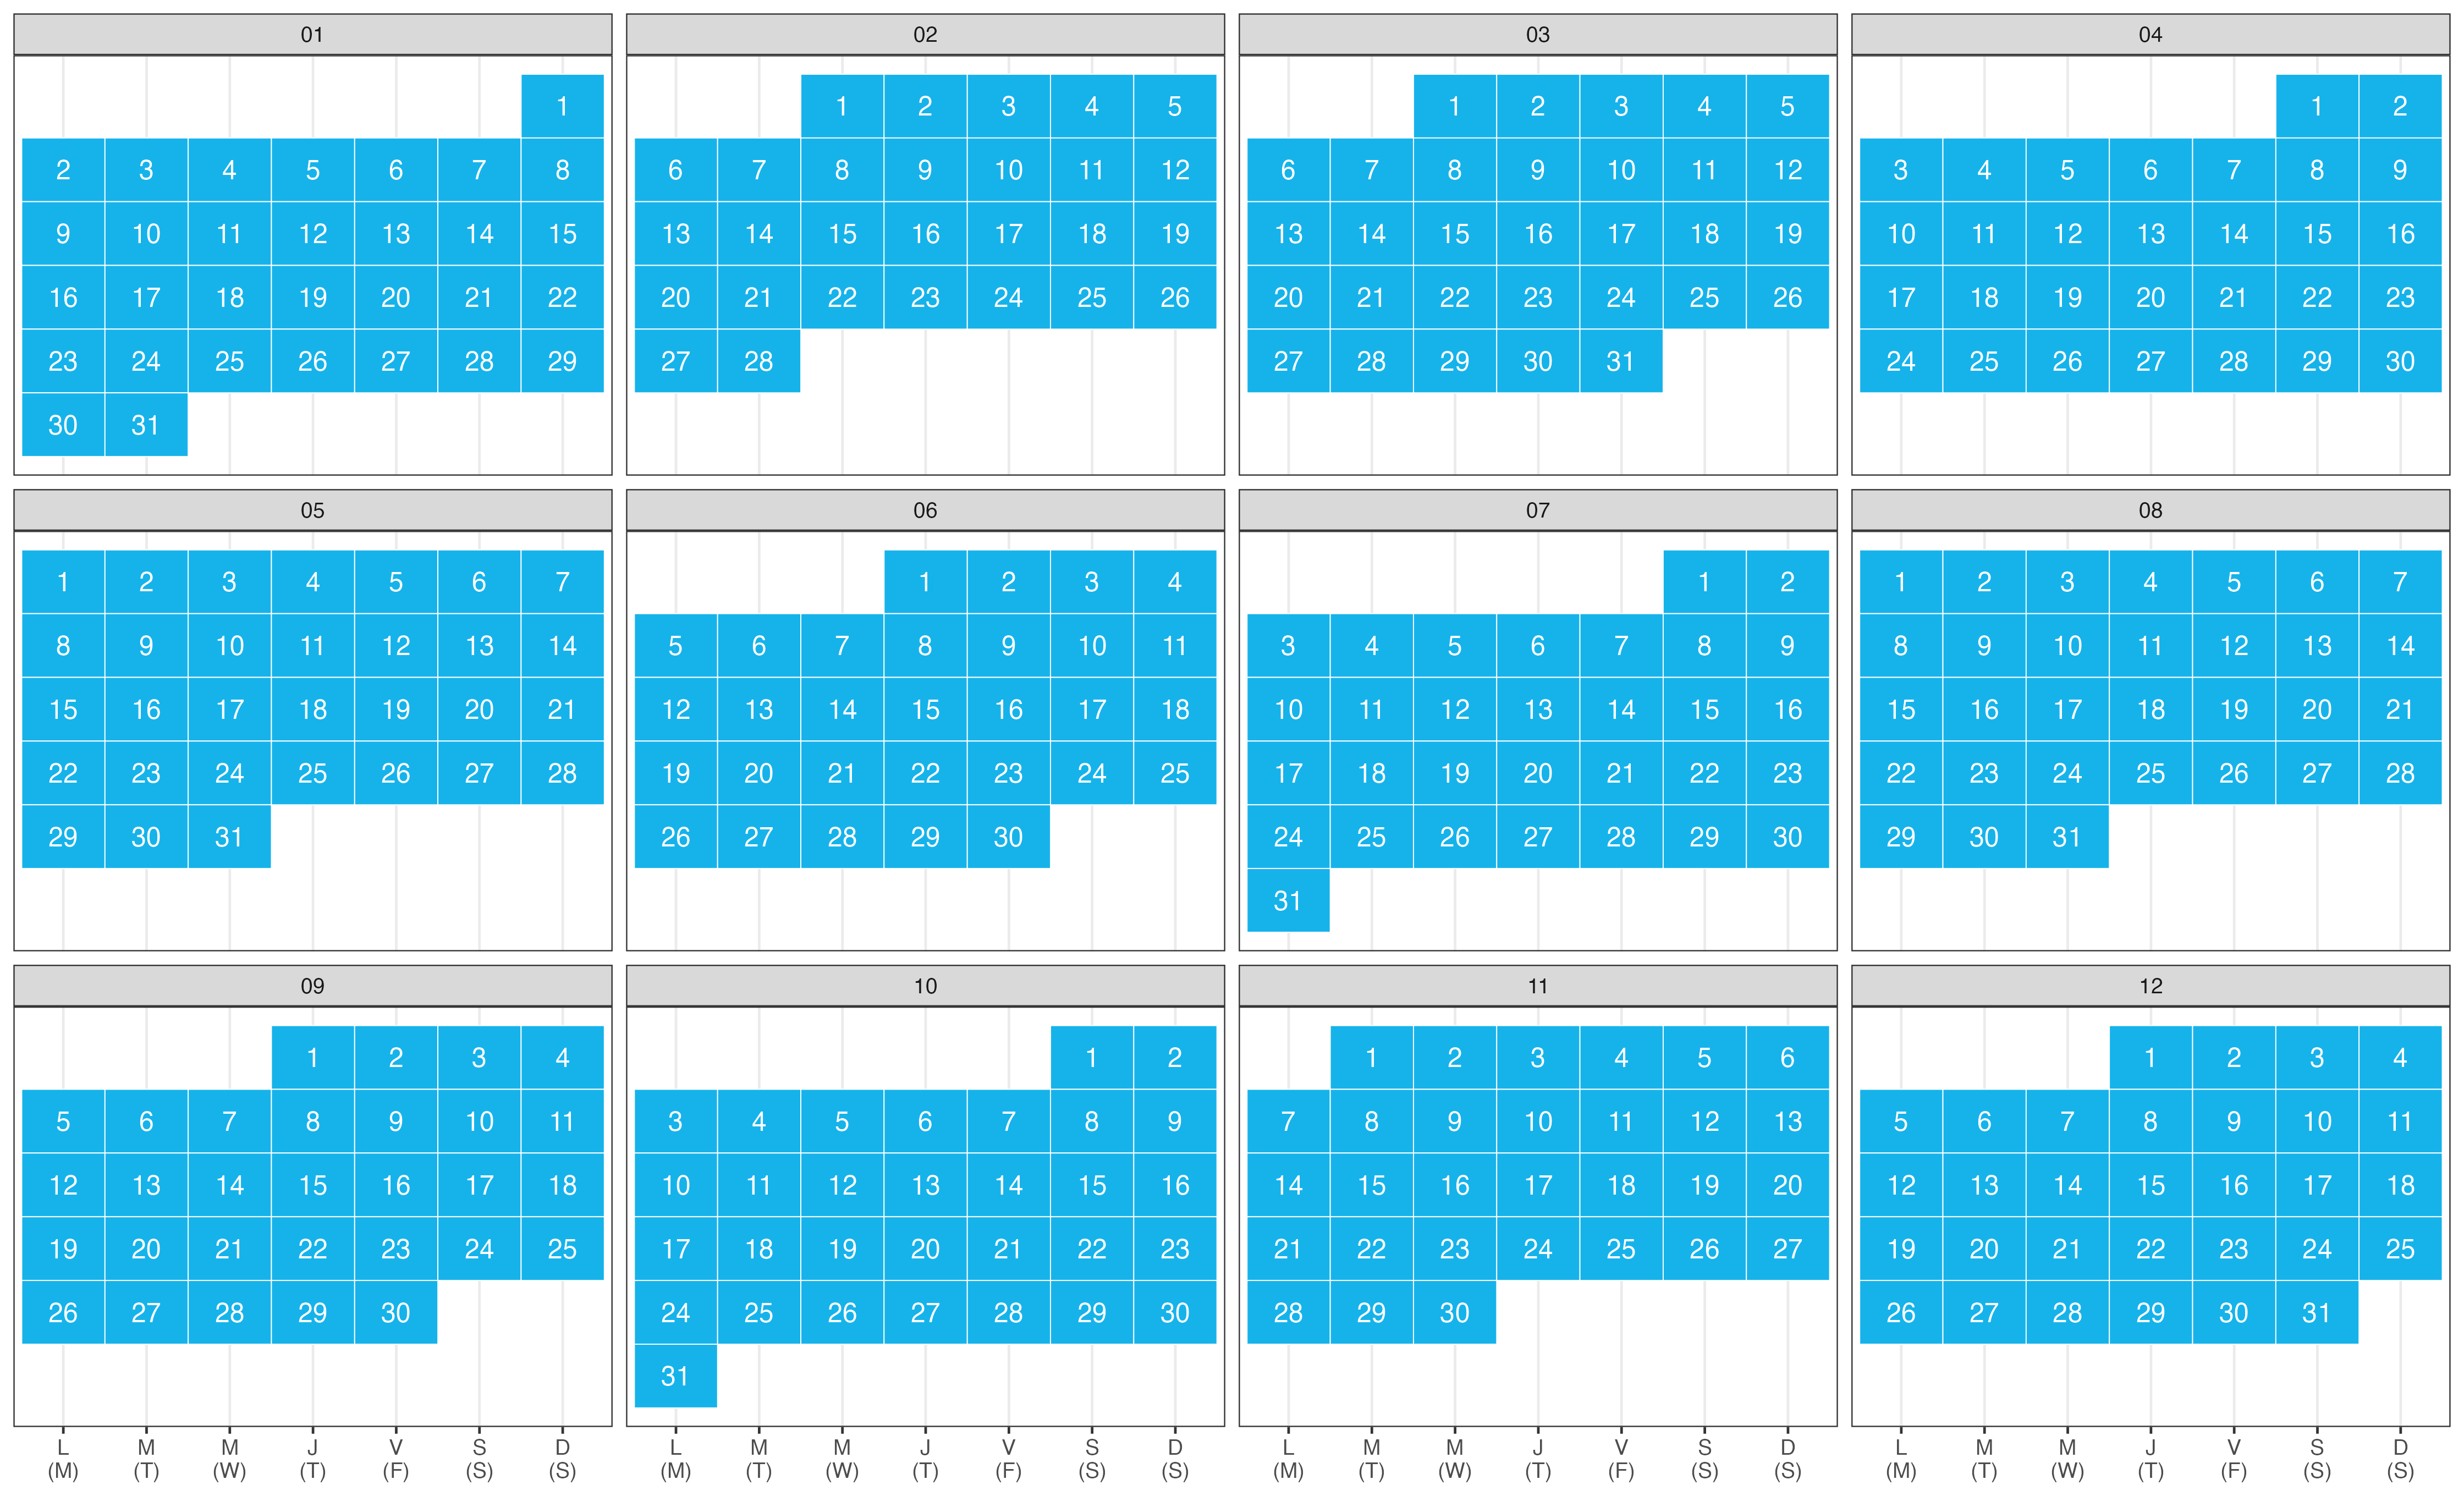
A crucial consideration when designing rainwater harvesting systems is understanding the system's water demand. This involves knowing how many days a year water is consumed. You can choose the calendar that best describes your building's operation from the 'Calendar' menu in the 'Calculator' section.
For residential buildings, we recommend using the '7 working days per week' option; for offices, '6 or 5 working days per week'; and for schools, '5 working days per week plus school holidays'. The following calendars show examples for each of the calendar alternatives. Days with water consumption are displayed in blue, and days with no water consumption are displayed in grey:
5 working days plus school holidays
5 days
6 days
7 days
References
[1] Value recommended by Isla Urbana in 2017.
[2] Gleick, Peter. 1996. Basic Water Requirements for Human Activities: Meeting Basic Needs. Pacific Institute.
[3] Value estimated by Cántaro Azul in 2017.
[4] Interviews conducted by Cántaro Azul with suppliers of the National Drinking Water Program. 2017.
[5] Committee for Maintenance and Update of the Sisevive-Ecocasa. Housing Water Savings Simulator. 2016.
[6] Fick, S.E. y R.J. Hijmans, 2017. WorldClim 2: new 1km spatial resolution climate surfaces for global land areas. International Journal of Climatology 37 (12): 4302-4315.
This is an initiative of Cántaro Azul, Isla Urbana and Neta Cero, funded by the Fundación Gonzalo Río Arronte and developed by CAPSUS, 2026.